This is a note about MIT's The Missing Semester of Your CS Education 2020, 2019.
Continuously updating.
Base Command
echo
echo Hello\ World
echo $PATH
#echo prints the content which is followed.
#\ means space. Bash is space sensitive and needs to be escaped.
which
which echo
#which prints that if i run echo,which echo will be run and show its path.
cd
cd ~
#change pwd to user/home

cd /
#change pwd to root

cd -
#change pwd to the directory you were previously in

cd ../
#change pwd to previous level
pwd
pwd
#show your crruent working directory
ls
ls
#show the files and directories

ls -l
#show more details 
It shows every stuff's detail in this directory. The owner,the type of the stuff,the permissions...
The permissions are divided into three groups. They are the owner,the owner's group,everyone. Each group bits mean read,write,execute. For the directory(which first bit is d), the execute bit means if you have the permission to cd to this directory. The - bit means you don't have the permission.
man
man ls
man cd
man ...
man signal.7
#show a manual page for us.Litte easy to read and navigate then --help
Ctrl + L
means clearSmall Tools
mv oldPath newPath
#rename or move

cp oldPath newPath
#copy

rm -r path
rm path
#delete files. -r means recursion

rmdir path
#delete directories.

mkdir path
make 'my photo'
#make directory. you can use '' or "" means the whole string

sudo
# do as su

diff <(ls foo) <(ls bar)
#compare the difference between two files.
tldr
tldr ffmpeg

tldr elf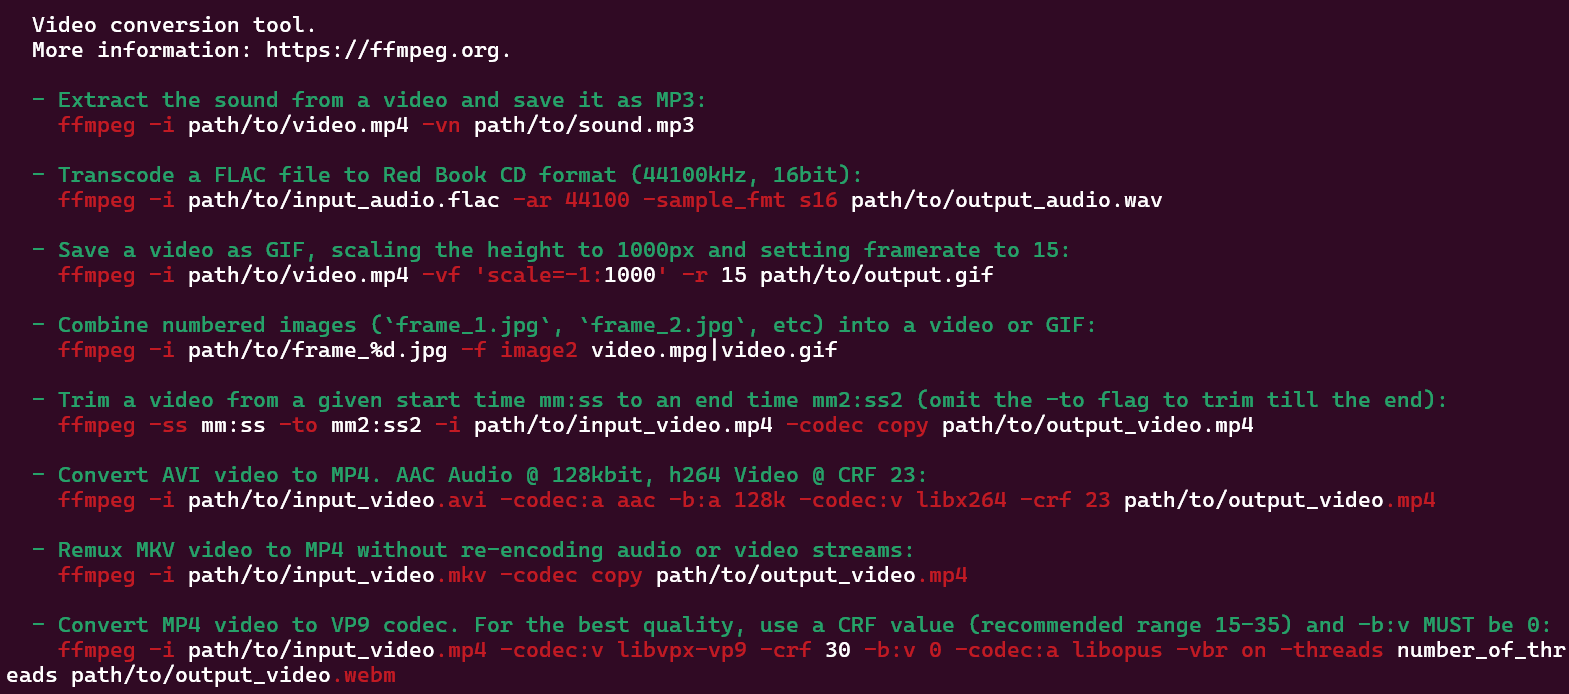
It shows many examples that how to use the elf. It is community maintenance.
find
find . -name src -type d
find . -name foo -type f
find . -path '**/test/*.py' -type f

find . -name "*.tmp" -exec rm {} \;
locate
locate "search_pattern"
#use index to fine files

updatedb
#update the database (index)
grep
Search string
grep foobar mcd.sh
grep -R foobar .
history , Ctrl + R
history

history 10 | grep ffmpeg
Redirect,Pipe
echo hello > hello.txt
cat < hello.txt
cat < hello.txt > hello2.txt
cat cat < hello.txt >> hello2.txt
# >> means append

ls -l / | tail -n1 > ls.txt
#print the last line of "ls -l /"
#ls don't know tail and tail don't know ls

curl --head --silent google.com | grep -i content-length | cut --delimiter=' ' -f2
tree
A tool helps you know the structure of directories easily.
tree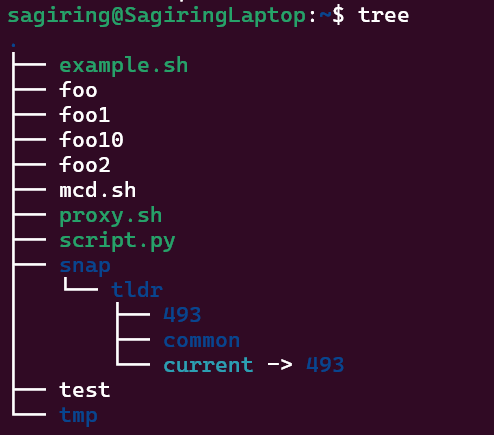
autojump
A tool helps you jump to recent directory.
autojump
j
#autojump - a faster way to navigate your filesystem
j opt
# jump to the opt directory you have gone before.
man autojump
Root directory
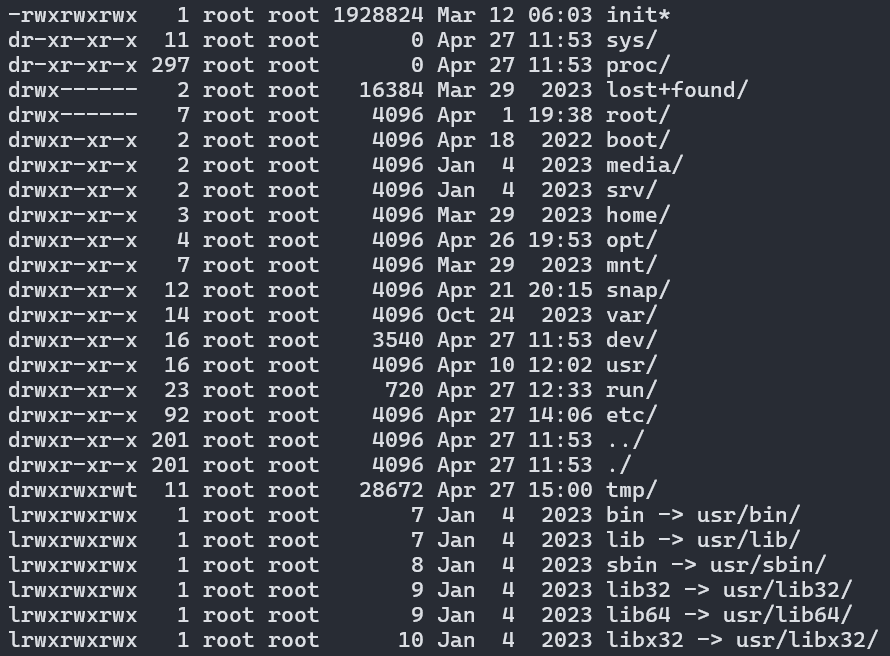
/bin - Binaries
The /bin folder contains programs that are essential for the system to boot and run. So, if you destroy this folder, your system won’t boot and run.
/boot - Boot File
This folder is needed to boot your system. It contains the Linux kernel, initial RAM disk image for drives need at boot time, and the bootloader.
/dev - Device Nodes
An important concept of Linux – everything is a file.
The /dev folder contains files for all devices your Linux is able to recognize.
/etc – Configuration Files
The /etc folder comprises all system-wide configuration files and some shell scripts that are executed during the system boot. All files here are text files, so they are human readable.
/home
The home directory contains a home folder for each regular user on your Linux system.
/lib – Libraries
You already know the /bin directory that contains programs, this /lib folder contains libraries required by those programs from the /bin folder.
/lost+found – Recovered Files
This is a file system specific folder that is used for data recovery in case of file corruption. Unless something bad has happened, this folder should be empty on your system. You will have this directory if you use the ext4 file system.
/media – Automatic mount point
This folder is used for automatic mounting of removable media such as USB drives, CD-ROM etc. For example, if your system is configured for automatic mounting, when you insert a USB drive it will be mounted to this folder.
/mnt – Manual mount point
The /mnt folder is similar to the /media folder, it is also used to mount devices, but usually, it is used for manual mounting. You, of course, can manually mount your devices to /media, but to keep some order in your system it is better to separate these two mounting points.
/opt – Optional Software
This folder is not essential for your system to work. Usually, it is used to install commercial programs on your system. For example, my Dropbox installation is located in this folder.
/proc – Kernel Files
This is a virtual file-system maintained by the Linux kernel. Usually, you do not touch anything in this folder. It is needed only for the kernel to run different processes.
/root – Root Home
This is the home directory of your root user. Don’t mix it with the / root directory. The / directory is the parental directory for the whole system, whereas this /root directory is the same as your user home directory but it is for the root account.
/run – Early temp
The /run is a recently introduced folder that is actually a temporary file-system. It is used to store temporary files very early in system boot before the other temporary folders become available.
/sbin – System Binaries
Similar to /bin this folder contains binaries for essential system tasks but they are meant to be run by the super user, in other words, the administrator of the system.
/srv – Service Data
This directory contains service files installed on your system. For example, if you installed a web-served on your Linux system, it will be located in this folder.
/tmp – Temporary Files
This is just a place where programs store temporary files on your system. This directory is usually cleaned on reboot.
/usr – User Binaries
This is probably the largest folder after your home folder. It contains all programs used by a regular user.
/usr/bin contains the programs installed by your Linux distribution. There are usually thousands of programs here.
/var – Variable Files
The /var contains files that are of variable content, so their content is not static and it constantly changes. For example, this is where the log files are stored. If you don’t know, a log file is a file that records all events happening in your system while it is running. These log files often help to find out if something is not working correctly in your system.
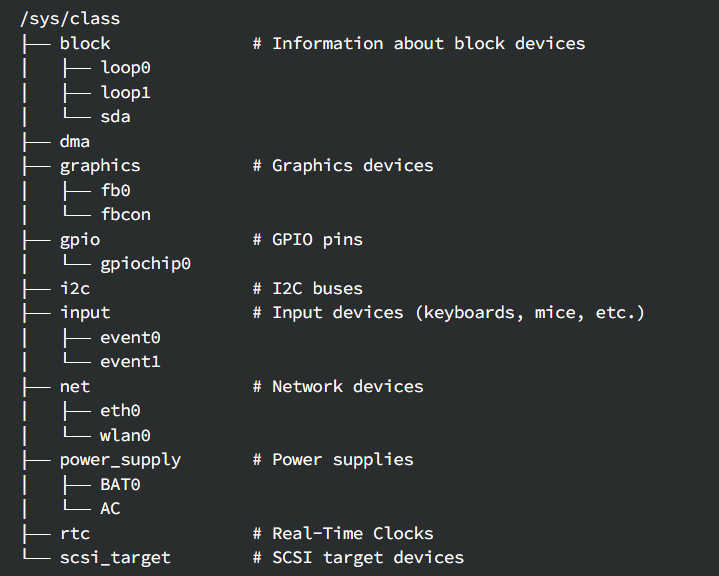
/sys
The kernels' arguments show as a file. Change the file to control the device.
/sys/class is a directory in the Linux filesystem that provides a way to interact with the kernel and access information about various classes of devices and subsystems.
echo 1060 | sudo tee brigthness
#Change the brightness of the device to 1060
#tee means write and show in shell
References
- https://averagelinuxuser.com/linux-root-folders-explained/
- [https://medium.com/@The_CodeConductor/lets-understand-sys-class-in-linux-efc38a2b4900](https://medium.com/@The_CodeConductor/lets-understand-sys-class-in-linux-efc38a2b4900)
The control flow functions in bash
variable
foo=bar
echo $foo
> bar
#foo = bar is wrong. Be careful with the space.

echo "Hello World"
>Hello World
#define a string

echo "Value is $foo"
> Value is bar
echo 'Value is $foo'
> Value is $foo
#the difference between "" and ''

foo=$(pwd)
#get the pwd's result,then give it to foo

cat <(ls) <(ls ..)
#() will make a tmp file to save the result
Special Variable
$0
#name of program

$1,$2,$3
#args

$?
#get the error code from the previous command

$_
#get the last arg of the previous command

!!
#get the previous command

$$
#get previous command's pid

true
false
Connector
||
#and

&&
#or

;
#run it anyway
Wildcards
ls *.sh
#show the stuff which is endwith '.sh'

ls project?
#show the stuff which is project plus one any char.

touch foo{,1,2,10}
#creat foo  foo1  foo10  foo2 files

touch project{1,2}/test{1,2,3}
#creat 6 files with combination {} and {}
Function
mcd(){
 mkdir -p "$1"
 cd "$1"
}
#or
source mcd.sh
Example
#!/bin/bash
#magic line

echo "Starting program at $(date)"

echo "Running program $0 with $# arguments with pid $$"

for file in "$@"; do
    grep foobar "$file" > /dev/null 2> /dev/null
    #redirect STDOUT and STDERR to a null register

    if [[ "$?" -ne 0 ]]; then
        echo "File $file does not have any foobar, adding one."
        echo "# foobar" >> "$file"
    fi
done
Magic Line
#!/usr/bin/env python
#use env to find python

import sys
for arg in reversed(sys.argv[1:]):
    print(arg)
Run it only by "script.py".
./script.py a b c
Vim
Why normal mode?
Normal mode is programming language of vim, which you can communicate with vim to edit code as quick as you think.
Change Mode
i => insert
r => replace
v => visual
s-v => visual-line
c-v => visual-block
: => command
ESC => normal
Command
:w => write
:q=> close the top window
:qa=> close the all windows
Navigate,Move Command
h =>move left
j => move down
k => move up
l => move right
w => forward by on word
b => back by on word
e => forward to the tail of one word
^ or 0 => head of line
$ => tail of line
Ctrl U => scroll up
Ctrl D => scroll down
G => end of file
gg => head of file
L M H => move cursor to the {lowest,mid,highest} of screen
f{char} => move cursor to char which is first appearance in line.
t{char} => t means two. Similar with f{char}.
T{char} => Similar with t{char}. But move back.
% => to jump between matching parentheses.
/ + pattern => search the pattern and move cursor to it.
n => to the next one.
Ctrl w + jk => change vim windows.
Edit Command
i => insert.
O => create a new line to insert.
u => cancel.
Ctrl r => redo.
dd => delete the whole line
d + hjkl(move) w(word)e(end) => delete specified direction
c + e => change the end and go to insert.
cc => delete the whole line and go to insert.
x => delete the char where the cursor is.
r{char} => replace the char where the cursor is.
y + move => copy. y means yank.
yy => copy the whole line.
p => paste.
d => cut
v + move + y => go to normal visual mode to select the text you want to copy.
V => select whole lines mode.
Ctrl v => select block mode.
~ => switch character case
. => repeat the previous edit command.
Count Command
num + Move Command
num + Edit Command
=> do the command n times
Modifiers
a => around
i => inside
example:
c i ( => change inside ().
d a ( => delete () and itself.
Exercise Demo
def fizz_buzz(limit):
    for i in range(limit):
        if i % 3 == 0:
            print('fizz')
        if i % 5 == 0:
            print('fizz')
        if i % 3 and i % 5:
            print(i)

def main():
    fizz_buzz(10)

#use vim to fix it.
import sys

def fizz_buzz(limit):
    for i in range(1,limit+1):
        if i % 3 == 0:
            print('fizz',end='')
        if i % 5 == 0:
            print('buzz',end='')
        if i % 3 and i % 5:
            print(i)

def main():
    fizz_buzz(int(sys.argv[1]))

if __name__ == '__main__':
    main()
Tips
In bash or in python, you can press Esc to put you into normal mode. You can use d to delete the word. Cool.
Data Wrangling
This will help you get useful data from a lot of data, which only use one command line. Useful.
Tools
journalctl
#print log

less
#make pages

sed
#stream editor
#replace in the stream. Do it line by line.
sed 's/.*Disconnected from//'
#use regex expression to replace
sed -E 's/(ab)*//g'
#use new regex rule
sed -E -n "s/.*Disconnected from user (.*) [0-9.]+ port [0-9]+/\1/p"
#get the secound capture gourp
# use -n and p command to only print the lines which were replaced.

wc
wc -l
#print the num of lines

sort
sort -nk1,1
#-n means number sort
#-k means split by space of input
#1,1 start from first column and end at the first column, by this column
#type man sort or tdlr sort to know the args

uniq
uniq -c
#-c is count mode.

awk
awk '{print $2}'
#split by space and print the secound column
awk '$1 == 1 && $2 ~ /^c.*e$/ {print $0}'
#it will match
#the first line of value is 1 and
#the secound line which is start with c,end at e.
awk 'BEGIN {rows = 0} $1 == 1 && $2 ~ /^c.*e$/ {rows+=1} END {print rows}'

paste
paste -sd,
#receive a bunch of lines and pastes them together into a line
#use comma as delimiter

bc
bc -l
#read the string and convert it to the arithmetic expression to calculate to result.

R
R --slave -e 'x <= scan(file="stdin",quiet=TRUE); summary(x)'
#statistics tool

gnuplot
gnuplot -p -e 'set boxwidth 0.5;plot "-" using 1:xtic(2) with boxes'
#Visual statistical tool

xargs
cat log.txt | xargs echo
# xargs helps you use command which cannot receive a input and use args as input by |.
find /tmp -name core -type f -print | xargs /bin/rm -f
# Find files named core in or below the directory /tmp and delete them.  Note that this will work incorrectly if
find /tmp -name core -type f -print0 | xargs -0 /bin/rm -f
# Find  files named core in or below the directory /tmp and delete them, processing filenames in such a way that
cut -d: -f1 < /etc/passwd | sort | xargs echo
# Generates a compact listing of all the users on the system.
Demo
cat log.txt | grep sshd | sed -E -n "s/.*Disconnected from user (.*) [0-9.]+ port [0-9]+/\1/p" | sort | uniq -c | sort -nk1,1 |awk '{print $2}'|paste -sd,
# print sshd login users by ascending order

cat log.txt | grep sshd | sed -E -n "s/.*Disconnected from user (.*) [0-9.]+ port [0-9]+/\1/p" | sort | uniq -c | sort -nk1,1 |awk '{print $1}'|paste -sd+|bc -l
# print the sum of logins
Job Control
sleep
sleep
sleep 20
Ctrl + C to exit the program.
Ctrl + C sends a signal to the program. Use man signal to see them all.
signal
demo
#!/usr/bin/env python
import signal,time

def handler(signum,time):
    print("\nI got a SIGINT, but I am not stopping")

signal.signal(signal.SIGINT,handler)
i = 0
while True:
    time.sleep(.1)
    print("\r{}".format(i), end="")
    i += 1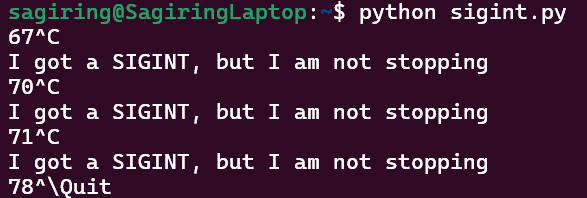
Ctrl C is not work, but Ctrl \ does. Different signals were sent to the program.
Command
Ctrl C and Ctrl \ will terminate the program.
Ctrl Z will suspend the program. fg to continue.
nohup sleep 2000 &
# run this program in the background.
# encapsulating the command you are executing
# ignore whatever signal you get, except KILL.
# so that keep it running.

jobs
# print the programs which are running or suspended

bg %n
# n is a number. continue the suspended program n.
# send a continue signal

kill
# send any sort of Unix signal
kill -STOP %n
# send a STOP signal
kill -KILL %n
# send a KILL signal
Terminal multiplexer
Hierarchy
- Sessions
- Windows
- Panes
- Windows
windows => tags in web browser.
tmux
tmux

tmux a -t foobar
# attach to a session called foobar

tmux new -t foobar
# create a new session called foobar

tmux ls
# print all sessions
Ctrl D => exit the current window.
Ctrl B => prefix. (Ctrl A is recommended.) Use more prefixes to detach from remote tmux.
c=> create a new window.p=> switch to the previous window.n=> switch to the next window.num=> switch to the specific window.,=> rename the current window."=> split the current display into two different panes.%=> split vertically.Direction=> switch between the panes.space=> switch different layout.z=> zoom the current panes.d=> detach from current session.
Dotfiles
alias can remap a source sequence of characters to a longer sequence.
alias ll="ls -lah"
alias mv="mv -i"

alias mv
> mv="mv -i"
However we don't want to retype it, after we get a new bash. So .bashrc appeared.
.bashrc
Persist the bash setting
alias mv='mv -i'

PS1="> "
# PS1 is a variable which control the prompt string of your bash.
That's same as .vimrc
How to modify a dotfile? How to learn about what can be configured?
https://missing-semester-cn.github.io/ => good resource in lecture note.
main idea is many people upload the configuration in the GitHub. We can search dotfile to find them.
Symlink
ln -s path/to/file symlink GNU Stow => a utility for automatically and safely linking your dotfiles folder into your home directory.
GNU Stow
Use it to make your dotfiles directory by follow steps.
First, make a dotfile folder under your $home, then move your dotfiles into this folder by make corresponding folder. Here is a example for my bash, vim, neovim, tmux.
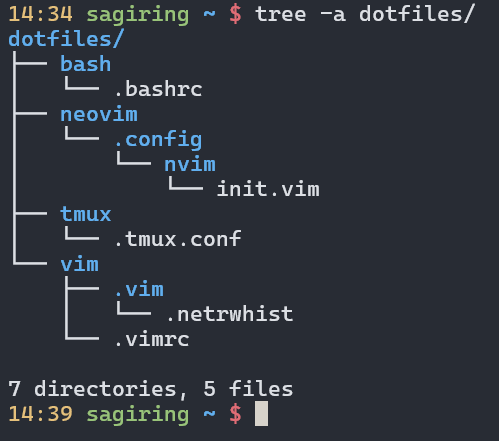
Make sure the directory structure is same as before.
Then use stow to make a symlink.
cd dotfiles
stow bash #make a symlink to .bashrc.
stow tmux # ...
stow vim
stow neovim
Here is the result.

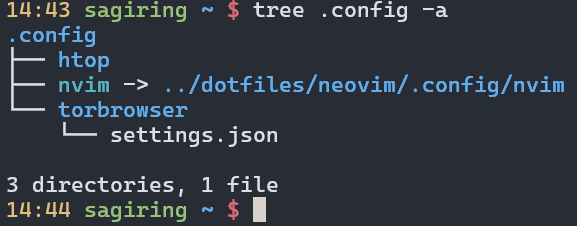
Now, you can use git to control the version of dotfiles easily.
Here is my dotfile in GitHub.
Remote Machine
ssh jjgo@192.168.246.142
ssh jjgo@foobar.mit.edu
ssh jjgo@192.168.246.142 ls -la
ssh MINIPC
# execute the command on remote and send back the result.

#SSH Keys use keypair to verify you identification.
ssh-keygen -o -a 100 -t ed25519
# copy key in .ssh

ssh-copy-id jjgo@192.168.246.142
# copy key to remote.

scp note.md jjgo@192.168.246.142:foobar.md
#copy more thing

rsync -avP . jjgo@192.168.246.142:cmd
# copy scores of thing. For example, use it to copy a folder.
.ssh/config => useful configuration. You can use PC's name instead of IP to connect.
Host MINIPC
    HostName IP
    User Sagiring
    Port 22
    IdentityFile path/to/privateKey


Host github.com
    User git
    Hostname github.com
    PreferredAuthentications publickey
    IdentityFile  path/to/privateKey
Git
Version control system. Git is the standard.

That is XKCD comic that illustrates Git's reputation.
I was one of the person in the comic,absolutely.
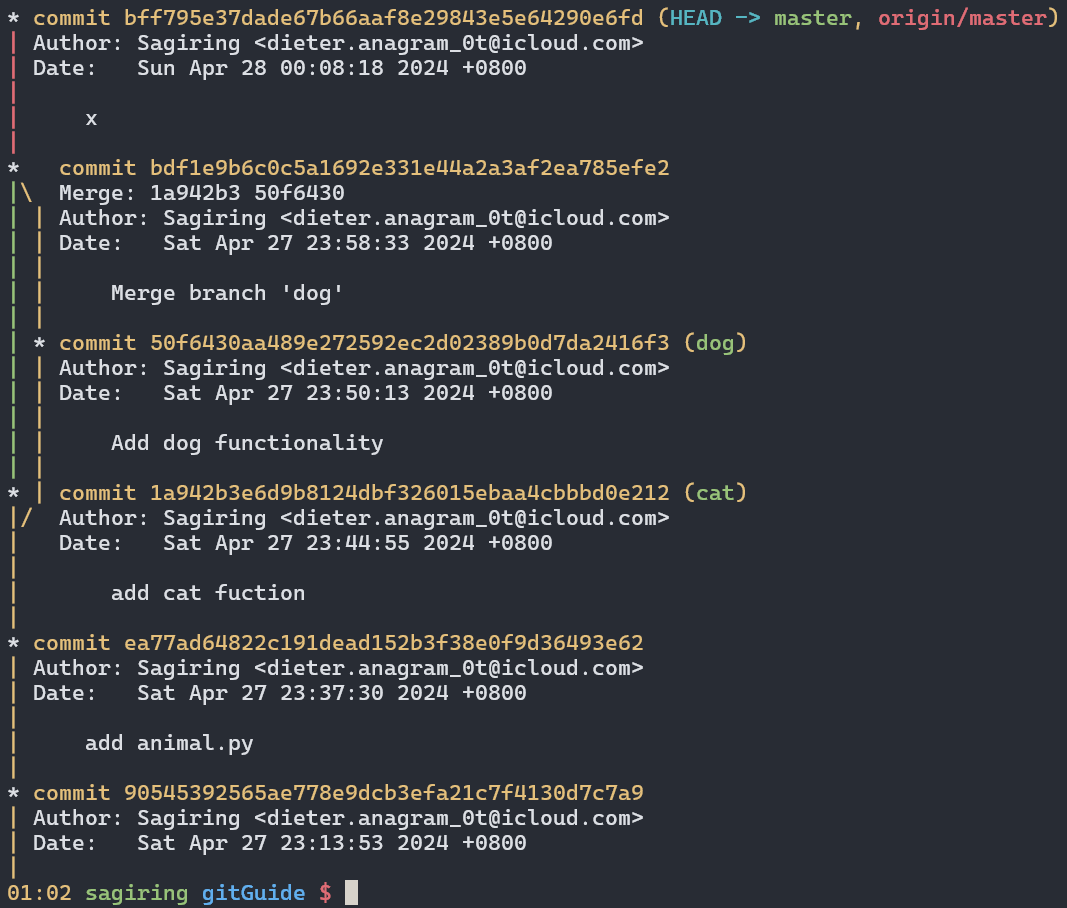
The structure of git
Here is a picture to show structure of git.
type blob = array<byte> #files
type tree = Map<String,tree | blob> #files or folders
type Commit = struct {
    parents:array<commit> #hash accutally
    author:Stirng
    message:String
    snapshot:tree #hash accutally
}
type object = blob | tree | commit

objects = Map<String,object>

def store(o):
    id = SHA1(o)
    objects[id] = o

def load(id):
    return objects[id]
Base Command
git init
# git initialize

git help {Command}
git status
git add {files}
git commit (-a -m '')
git log --all --graph --decorate --oneline
#HEAD is point that point the commit where you actually are

git checkout {hash|name}
git checkout hello.txt #HEAD
# change your working directory files into {hash|name} status.
# move HEAD point into {hash}->content

git diff {hash} hello.txt
git diff {hash} HEAD hello.txt
# what changes from {hash} to HEAD
git diff hello.txt
# diff the HEAD and now status

git branch -vv
# more detail about branch
git branch cat
# create a new branch called cat
git checkout cat

git merge cat
#Auto-merging and merge conflict
git merge --abort
git add animal.py
git merge --continue
git mergetool
See the hash's meaning.

Git Remote
git remote
git remote add <name> <URL|ssh|filePath>
git remote add origin ../remote/


git push <remote> <local branch>:<remote branch>
git push origin master:master
# set git push by
git branch --set-upstream-to=origin/master


git clone <url> <folder>
git clone remote/ demo2

git fetch
#update from remote
git merge
git pull
# same with git fetch;git merge
Other Command
git config
# vim ~/.gitconfig
git clone --shallow
# only clone the lastest snapshot.
git add -p animal.py
git diff --cached

git blame .bashrc
git show bd8d1510
#show more modification detail about file.

git stash
git stash pop
# here is a img example for use it.

git bisect
# auto find the problem commit
.gitignore file => tell git which files need to be ignore.
A nice book called ProGit is recommended to be read, if you want to know more about Git.
Debugging and Profiling
Debugging
Printf debugging and Logging
Here is a demo.
import logging
import sys

class CustomFormatter(logging.Formatter):
    """Logging Formatter to add colors and count warning / errors"""

    grey = "\x1b[38;21m"
    yellow = "\x1b[33;21m"
    red = "\x1b[31;21m"
    bold_red = "\x1b[31;1m"
    reset = "\x1b[0m"
    format = "%(asctime)s - %(name)s - %(levelname)s - %(message)s (%(filename)s:%(lineno)d)"

    FORMATS = {
        logging.DEBUG: grey + format + reset,
        logging.INFO: grey + format + reset,
        logging.WARNING: yellow + format + reset,
        logging.ERROR: red + format + reset,
        logging.CRITICAL: bold_red + format + reset
    }

    def format(self, record):
        log_fmt = self.FORMATS.get(record.levelno)
        formatter = logging.Formatter(log_fmt)
        return formatter.format(record)

# create logger with 'spam_application'
logger = logging.getLogger("Sample")

# create console handler with a higher log level
ch = logging.StreamHandler()
ch.setLevel(logging.DEBUG)

if len(sys.argv)> 1:
    if sys.argv[1] == 'log':
        ch.setFormatter(logging.Formatter('%(asctime)s : %(levelname)s : %(name)s : %(message)s'))
    elif sys.argv[1] == 'color':
        ch.setFormatter(CustomFormatter())

if len(sys.argv) > 2:
    logger.setLevel(logging.__getattribute__(sys.argv[2]))
else:
    logger.setLevel(logging.DEBUG)

logger.addHandler(ch)

# logger.debug("debug message")
# logger.info("info message")
# logger.warning("warning message")
# logger.error("error message")
# logger.critical("critical message")

import random
import time
for _ in range(100):
    i = random.randint(0, 10)
    if i <= 4:
        logger.info("Value is {} - Everything is fine".format(i))
    elif i <= 6:
        logger.warning("Value is {} - System is getting hot".format(i))
    elif i <= 8:
        logger.error("Value is {} - Dangerous region".format(i))
    else:
        logger.critical("Maximum value reached")
    time.sleep(0.3)
In UNIX systems, it is commonplace for programs to write their logs under /var/log.
For instance, the NGINX webserver places its logs under /var/log/nginx.
logger "Hello Logs"
journalctl --since "1m ago" | grep Hello
Debuggers
gdb => as a example. pdb => Python Debugger
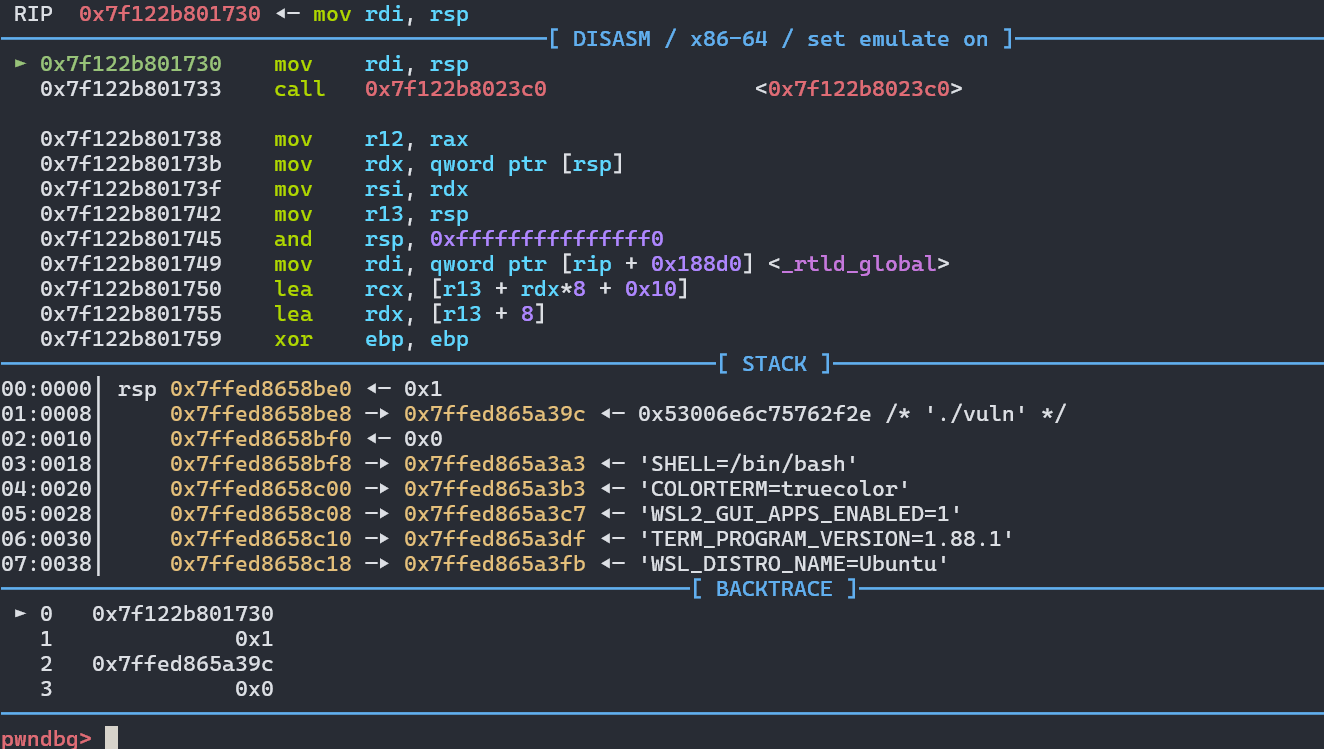
b + line|addr|name => break point
c => continue
r => restart
s => step into
n => step over
p + name => print stuff
x => print memory. x /gx10 addr is an example.
stack => print stack
canary => print canary value.
sudo strace -e ls -l > /dev/null
# print all syscalls that ls has executed.
# man strace to see more detail

# static analysis tools
pyflakes lint.py
mypy lint.py
writegoood note.md
For web, you can just use the debugger in browser or other tools,such as fiddler or WireShark.
Profiling
Timing
A demo for Python.
import time, random
n = random.randint(1, 10) * 100

# Get current time
start = time.time()

# Do some work
print("Sleeping for {} ms".format(n))
time.sleep(n/1000)

# Compute time between start and now
print(time.time() - start)

# Output
# Sleeping for 500 ms
# 0.5713930130004883
However, wall clock time can be misleading since your computer might be running other processes at the same time or waiting for events to happen.
- Real - Wall clock elapsed time from start to finish of the program, including the time taken by other processes and time taken while blocked (e.g. waiting for I/O or network)
- User - Amount of time spent in the CPU running user code
- Sys - Amount of time spent in the CPU running kernel code
time curl https://missing.csail.mit.edu &> /dev/null
# real    0m0.486s
# user    0m0.031s
# sys     0m0.001s
Profilers
CPU
In Python we can use the cProfile module to profile time per function call. Here is a simple example that implements a rudimentary grep in Python:
#!/usr/bin/env python

import sys, re

def grep(pattern, file):
    with open(file, 'r') as f:
        print(file)
        for i, line in enumerate(f.readlines()):
            pattern = re.compile(pattern)
            match = pattern.search(line)
            if match is not None:
                print("{}: {}".format(i, line), end="")

if __name__ == '__main__':
    times = int(sys.argv[1])
    pattern = sys.argv[2]
    for i in range(times):
        for file in sys.argv[3:]:
            grep(pattern, file)
python -m cProfile -s tottime grep.py 1000 '^(import|\s*def)[^,]*$' *.py
[omitted program output]
ncalls tottime percall cumtime percall filename:lineno(function)
8000 0.266 0.000 0.292 0.000 {built-in method io.open}
8000 0.153 0.000 0.894 0.000 grep.py:5(grep)
17000 0.101 0.000 0.101 0.000 {built-in method builtins.print}
8000 0.100 0.000 0.129 0.000 {method 'readlines' of '_io._IOBase' objects}
93000 0.097 0.000 0.111 0.000 re.py:286(_compile)
93000 0.069 0.000 0.069 0.000 {method 'search' of '_sre.SRE_Pattern' objects}
93000 0.030 0.000 0.141 0.000 re.py:231(compile)
17000 0.019 0.000 0.029 0.000 codecs.py:318(decode)
1 0.017 0.017 0.911 0.911 grep.py:3(<module>)
[omitted lines]If we used Python’s cProfile profiler we’d get over 2500 lines of output, and even with sorting it’d be hard to understand where the time is being spent. A quick run with line_profiler shows the time taken per line:
#!/usr/bin/env python
import requests
from bs4 import BeautifulSoup

# This is a decorator that tells line_profiler
# that we want to analyze this function
@profile
def get_urls():
    response = requests.get('https://missing.csail.mit.edu')
    s = BeautifulSoup(response.content, 'lxml')
    urls = []
    for url in s.find_all('a'):
        urls.append(url['href'])

if __name__ == '__main__':
    get_urls()
kernprof -l -v a.py
Total time: 0.636188 s
File: a.py
Function: get_urls at line 5
Line # Hits Time Per Hit % Time Line Contents
==============================================================
5 @profile
6 def get_urls():
7 1 613909.0 613909.0 96.5 response = requests.get('https://missing.csail.mit.edu')
8 1 21559.0 21559.0 3.4 s = BeautifulSoup(response.content, 'lxml')
9 1 2.0 2.0 0.0 urls = []
10 25 685.0 27.4 0.1 for url in s.find_all('a'):
11 24 33.0 1.4 0.0 urls.append(url['href'])Memory
In languages like C or C++ memory leaks can cause your program to never release memory that it doesn’t need anymore. To help in the process of memory debugging you can use tools like Valgrind that will help you identify memory leaks.
In garbage collected languages like Python it is still useful to use a memory profiler because as long as you have pointers to objects in memory they won’t be garbage collected. Here’s an example program and its associated output when running it with memory-profiler (note the decorator like in line-profiler).
@profile
def my_func():
    a = [1] * (10 ** 6)
    b = [2] * (2 * 10 ** 7)
    del b
    return a

if __name__ == '__main__':
    my_func()
python -m memory_profiler example.py
Line # Mem usage Increment Line Contents
==============================================
3 @profile
4 5.97 MB 0.00 MB def my_func():
5 13.61 MB 7.64 MB a = [1] * (10 ** 6)
6 166.20 MB 152.59 MB b = [2] * (2 * 10 ** 7)
7 13.61 MB -152.59 MB del b
8 13.61 MB 0.00 MB return aEvent Profiling
As it was the case for strace for debugging, you might want to ignore the specifics of the code that you are running and treat it like a black box when profiling. The perf command abstracts CPU differences away and does not report time or memory, but instead it reports system events related to your programs. For example, perf can easily report poor cache locality, high amounts of page faults or livelocks.
sudo perf stat stress -c 1
sudo perf record stress -c 1
sudo perf report
Visualization
Call graphs, In Python you can use the pycallgraph library to generate them.
Resource Monitoring
htop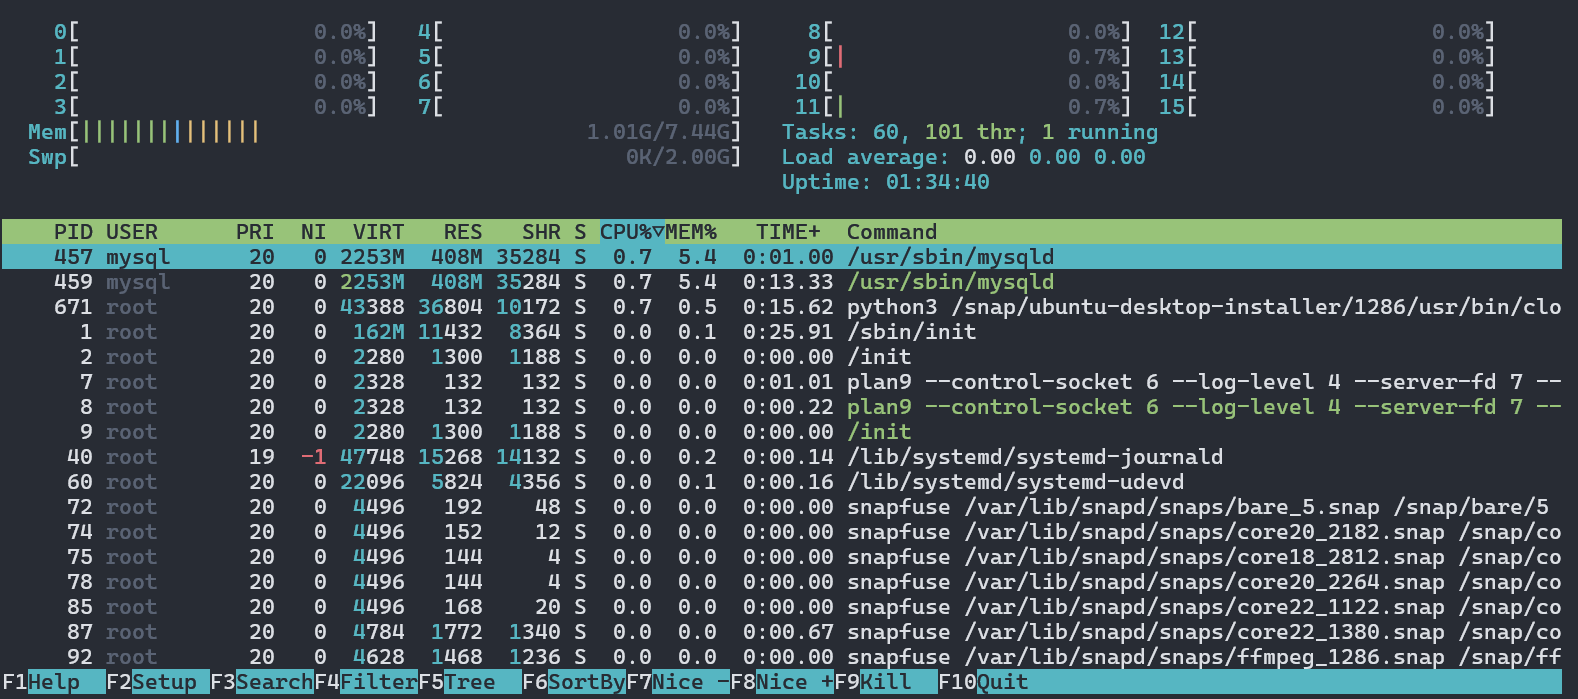
du -h
ncdu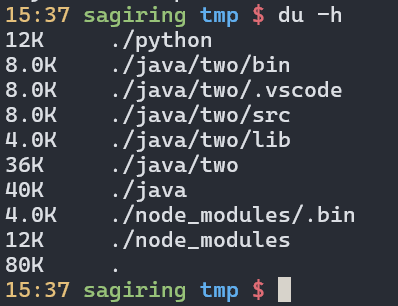

lsofLists file information about files opened by processes. It can be quite useful for checking which process has opened a specific file.
hyperfine --warmup 3 'fd -e jpg' 'find . -iname "*.jpg"'

Benchmark #1: fd -e jpg
  Time (mean ± σ):      51.4 ms ±   2.9 ms    [User: 121.0 ms, System: 160.5 ms]
  Range (min … max):    44.2 ms …  60.1 ms    56 runs

Benchmark #2: find . -iname "*.jpg"
  Time (mean ± σ):      1.126 s ±  0.101 s    [User: 141.1 ms, System: 956.1 ms]
  Range (min … max):    0.975 s …  1.287 s    10 runs

Summary
  'fd -e jpg' ran
   21.89 ± 2.33 times faster than 'find . -iname "*.jpg"'
Reference
More detail to see https://missing.csail.mit.edu/2020/debugging-profiling/.
Metaprogramming
This class was giving concepts about version, testing, building,managing dependencies and so on. So it is recommend to watch the lecture video or read the lecture note directly.
https://missing.csail.mit.edu/2020/metaprogramming/
Title also means programs that operate on programs.
make
#todo
Security and Cryptography
https://missing.csail.mit.edu/2020/security/
Entropy
Hash Functions
printf 'hello' | sha1sum
- non-invertiable
- collision resistant
Key Derivation Functions
KDFs
-slow